Von Michael Leist
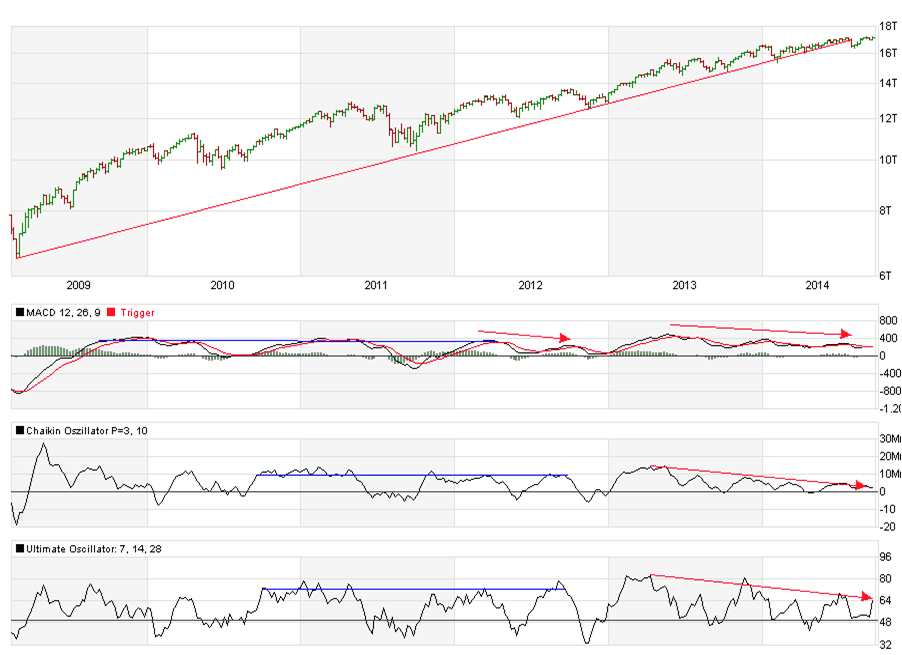
On a weekly based analysis (Fig. 1), several divergency containing MACD indicator, Chaikin and Ultimativ Oscilators co-occur in 2014 inside the DJ-Chart and were accombined by a break of the red supporting line which withstood since 2009 and had endured the crisis of 2011.
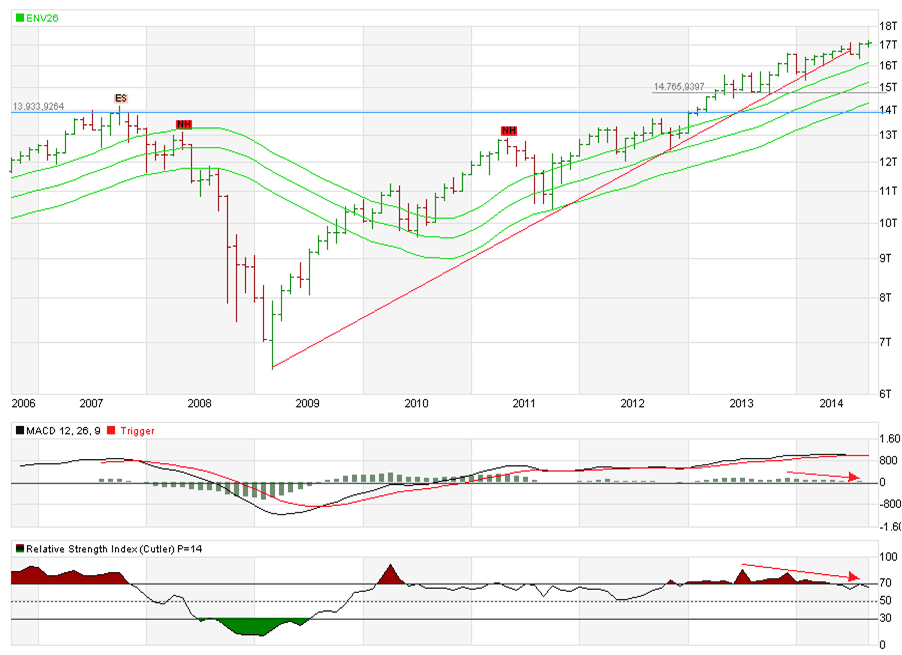
Among others, the Relative Strengthe Index as well as ENV26 lines on a monthly based analysis indicate an overbought market (Fig.2).
Therefore, you might be well advised to identify new supporting levels of the Index in case of an DJ-Index downfall.
Thus, I analysed horizontal supporting lines and Fibonacci resistances inside the ENVS area (Fig. 3) and found a region between 14766 and 14614 points (61,8% resistances) which seems to be the most likley reversal point and a probable target for the Index in 2015.
However, keep an eye on the negative Harmai candelstick pattern! If you see it in a monthly based Chart the downfall of the DJ-Index probably begins. Wish you good luck for the next months.
Best regards
Michael Leist

Kommentare lesen und schreiben, hier klicken


Guten Tag,
auf einer deutschen Internetseite sollten solche Text, wenn schon im Original abgedruckt, zumindest übersetzt werden.
Viele Grüße,
K. Naumann
Sehe ich ähnlich. Zumal die Überschrift ja dann doch auf deutsch ist. ;)
Hallo Herr Naumann,
es gibt über google hervorragende Übersetzungstools inzwischen; das Problem ist, dass für eine Übersetzung oft die Zeit fehlt – aber die Sprache der Finanzmärkte ist nun einmal englisch, insofern wage ich es gelegentlich, auch Videos und Texte im englischen Original darzustellen. Bitte haben Sie Verständnis dafür!
Viele Grüße
Wer ist Michael Leist eigentlich genau?