

Die US-Baubeginne (Mai) sind mit -14,4% und einer Jahresrate von 1,549 Millionen deutlich schwächer ausgefallen als erwartet (Prognose war eine Jahresrate von 1,701 Millionen; Vormonat war 1,810 Millionen).
Die US-Baugenehmigungen (ebenfalls Mai) sind mit -7,0% und einer Jahresrate von 1, 695 Millionen ebenfalls schwächer ausgefallen als erwartet (Prognose war eine Jahresrate von 1,785 Millionen; Vormonat war 1,823 Millionen).
Damit zeigt sich die starke Abkühlung am US-Immobilienmarkt deutlich durch die giftige Kombination aus (noch!) weiter steigenden Preisen und stark steigenden Hypotheken-)Zinsen!
——
Die US-Erstanträge (jobless claims) auf Arbeitslosenhilfe (für die letzte Woche) steigen um 229.000 (offizielle Prognose war 215.000, Vorwoche war 232.000).
Die fortgesetzen Anträge (continuing claimes) liegen mit 1,312 Millionen schlechter als die Erwartung (Prognose war 1,302 Millionen; Vorwoche war 1,306 Millionen).
——
Der Philadelphia Fed Index (Juni) ist mit -3,3 ebenfalls schwächer ausgefallen als erwartet (Prognose war +5,5; Vormonat war +2,6)
Die Komponenten:
Beschäftigung: 41,4 (Vormonat war 38,9)
Neue Aufträge: 17,8 (Vormonat war 25,8)
Preise: 64,5 (Vormonat war 78,9) – der Preisdruck also schwächer geworden!
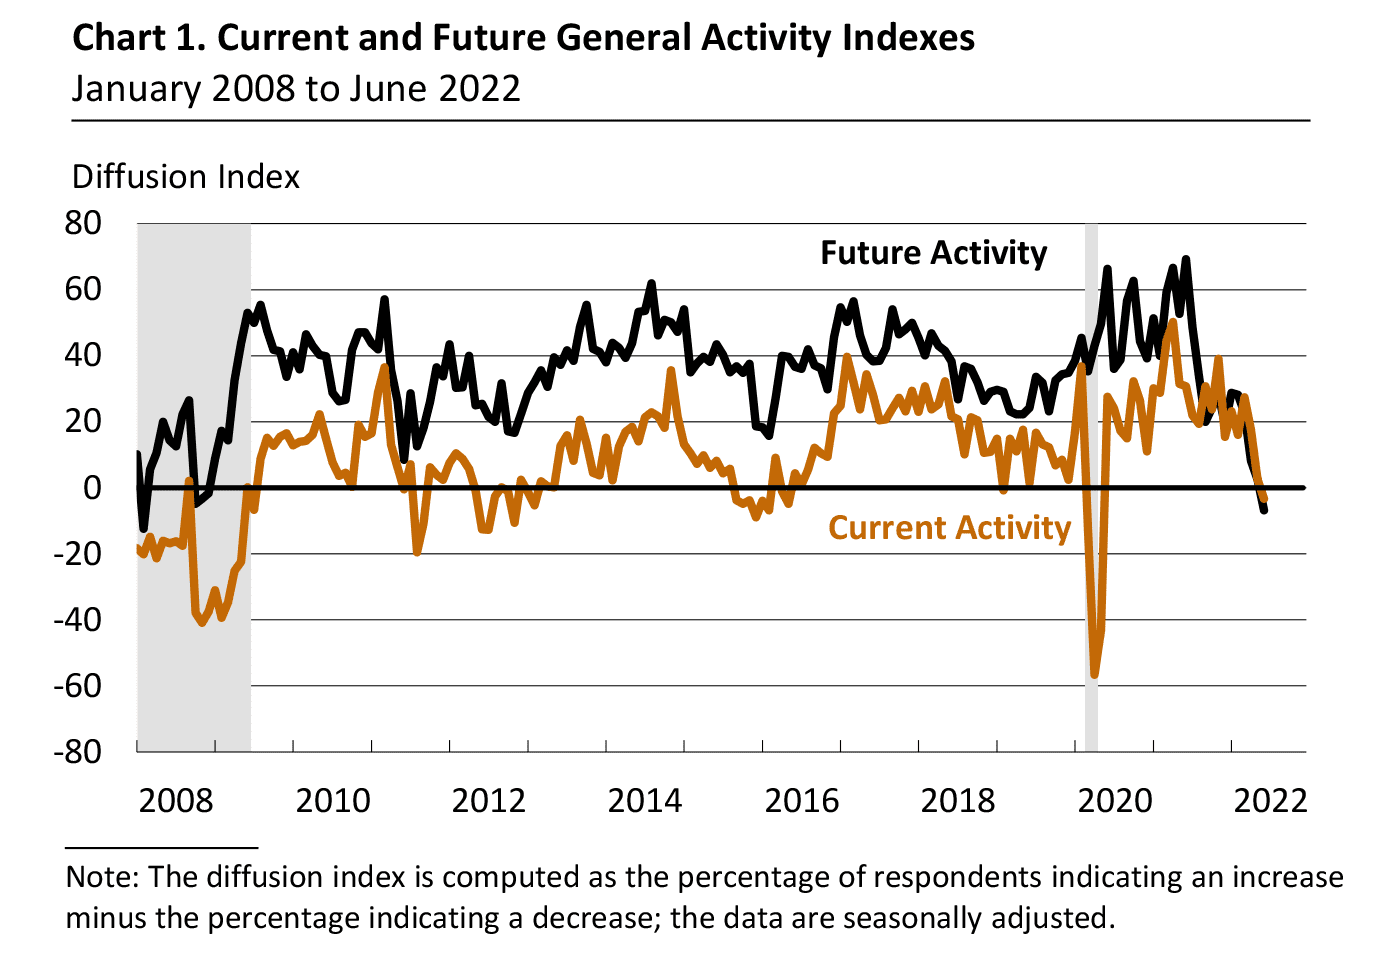
Folgender Chart der Philadelphia Fed zeigt die starke Abkühlung:
Dazu die Fed aus Philadelphia:
„Manufacturing activity in the region weakened, according to the firms responding to the June Manufacturing Business Outlook Survey. The indicators for current activity and new orders turned negative, and the shipments index also declined but remained positive. However, the firms reported continued increases in employment. Both price indexes declined but remained elevated. Expectations for growth over the next six months deteriorated, as the future general activity, new orders, and shipment indexes fell sharply.
Current Indicators Weaken
The diffusion index for current general activity declined for the third consecutive month, falling 6 points to -3.3. This is the index’s first negative reading since May 2020 (see Chart 1). Although most firms reported no change in activity (64 percent), the share of firms reporting decreases (20 percent) exceeded the share reporting increases (16 percent). The indicators for new orders and shipments decreased more sharply: The new orders index fell 35 points to -12.4, and the shipments index fell 25 points but remained positive at 10.8.
On balance, the firms continued to report increases in employment, and the employment index moved up from 25.5 to 28.1. More than 31 percent of the firms reported increases in employment, compared with 3 percent that reported decreases; 66 percent reported no change. The average workweek index decreased 4 points, to 11.8.“
Philly Fed Prices Paid in the United States decreased to 64.50 points in June from 78.90 points in May of 2022. https://t.co/0IcYkAWlMg pic.twitter.com/gWD2CUte3D
— Trading Economics (@tEconomics) June 16, 2022
Philadelphia Fed Manufacturing Index in the United States decreased to -3.30 points in June from 2.60 points in May of 2022. https://t.co/oPLlvh3iXC pic.twitter.com/lH2BgFdJEo
— Trading Economics (@tEconomics) June 16, 2022
Housing Starts in the United States decreased to 1549 Thousand units in May from 1810 Thousand units in April of 2022. https://t.co/bIvijD664Z pic.twitter.com/MYSYspF8r8
— Trading Economics (@tEconomics) June 16, 2022
Kommentare lesen und schreiben, hier klicken